Brand enablement keeps your teams aligned, your content consistent, and your brand recognizable as you scale. But when the question of ROI comes up, many teams struggle to define its impact clearly.
That impact shows up in everyday ways: when someone uses an outdated logo, when content requests pile up, or when brand guidelines are ignored or misused across busy non-creative departments.
These problems aren’t always dramatic, but they slow down your work and weaken your brand’s presence.
By implementing the right metrics, you can show how brand enablement drives real business outcomes and creates the buy-in you need to scale the brand.
This article will walk you through a practical approach to measuring brand enablement ROI.
In this article, you will learn:
- 5 core metrics that demonstrate brand enablement ROI
- Useful methods to measure KPIs
- A framework for mixing quantitative and qualitative data
- A simple way to present ROI to stakeholders (without overcomplicating it)
Brand Enablement vs Campaign ROI: What Are We Measuring?
When you bring up “brand enablement ROI,” people often expect to see results similar to campaign performance — click-through rates, leads generated, or direct revenue.
But brand enablement works on a different timeline.
Most marketing campaigns focus on short-term gains. You launch a promotion, track conversions, and report on immediate outcomes. It’s direct, measurable, and often tied to revenue.
Brand enablement isn’t like that.
Brand enablement supports the systems, assets, and behaviors that make campaigns successful in the first place. Its outcomes build over time and show up in areas like:
- Faster content creation
- Fewer off-brand assets
- Better use of approved materials
- Stronger brand consistency
- Smoother collaboration across teams
The ROI of brand enablement goes beyond quick wins. The value lies in improving how teams work with (and help maintain) your brand every day.
That kind of impact compounds over time, and when measured correctly, it becomes a powerful case for continued investment in brand enablement.
The 5 Core Metrics That Reveal Brand Enablement ROI
The right metrics can turn brand enablement from an abstract concept into something tangible and measurable. At Marq, we’ve built our analytics platform to track exactly that, helping our 6+ million users understand where their brand systems deliver value.
Below are five key metrics that consistently reveal the ROI of brand enablement across fast-scaling organizations.
1. Brand consistency rate
Brand consistency rate measures how often your brand’s messaging, visuals, and voice align with established guidelines across every channel.
The most obvious inconsistencies tend to show up in logos, colors, and typography. But consistency also applies to tone of voice, sales presentations, customer service scripts, and social media posts.
Social media, in particular, reveals where consistency often breaks down.
One well-known example of brand breakdown is Chase Bank’s 2019 tweet that appeared to blame customers for low account balances. The backlash was immediate. The post didn’t reflect the brand’s intended tone, and it quickly went viral for all the wrong reasons.

Auditing your brand before and after launching a brand enablement platform highlights the source and quantifies the true cost of these inconsistencies.
Often, identifying to-from consistency rates after rolling out your brand enablement system helps brand champions nurture team buy-in and build the momentum required to continue scaling and strengthening branded content programs.
Brand audits also strongly advocate continued investment by linking consistency to revenue performance. Beyond “looking unprofessional,” non-compliance penalties, ballooning misprint or re-print costs, and recruitment misses are real (and often untracked) costs of brand chaos.
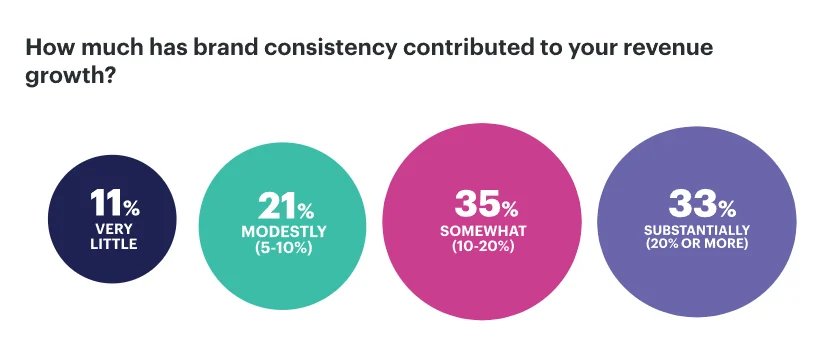
By contrast, The State of Brand Consistency reports that organizations that maintain strong brand consistency see a 10–20% lift in top-line revenue.
2. Content velocity
Content velocity measures the speed at which brand-approved content moves from creation or request to publication. It’s about reducing the “time to publish” for all your marketing and sales materials.
For fast-scaling companies, brand consistency and content velocity are often bottlenecks.
Consider one of Marq’s customer stories, from real estate agency Engel & Völkers.
They had expanded to 50 offices across seven US states, but lacked a systematic way to ensure consistent marketing. As a result, their 700+ advisors faced delays of several days when requesting content and visuals.
By implementing Marq’s brand portal features, Engel & Völkers saw a dramatic improvement. A key outcome was advisors receiving their content requests in under a day.
If this metric matters to your team, you can start by measuring how long it takes to fulfill requests across departments.
You can also get a demo to see how Marq’s analytics dashboards can measure metrics like content velocity automatically.
Having a platform that not only brings consistency to our advisors’ marketing, but also allows them to request an asset one day and receive it the next day is a huge advantage for them and for us, especially in an industry that changes and shifts so rapidly.
Rick Rybarczyk, Director of Marketing Engel & Volkers Gestalt Group
3. Asset reuse
Asset reuse shows how often teams use approved brand templates and materials across different campaigns. It’s a strong indicator of whether your content library is working and whether teams can find the assets they need.
This metric also works hand-in-hand with version control.
Without a central system, different teams might create their own versions of assets, often with outdated logos or messaging. That leads to confusion, inconsistency, and extra design work.
It’s challenging to measure asset reuse and maintain version control without a robust Digital Asset Management (DAM) like the one offered by Marq.
Our built-in analytics, for instance, allow you to see:
- Template adoption: Which templates are used most often, by which departments, and how many times.
- Approval status: Flag projects that are not yet approved, ensuring correct asset usage.
- Content freshness: Discover content that needs to be refreshed based on its usage or non-usage, and then take action through creative automation.
4. Content Request Reduction
When brand enablement works, teams make fewer one-off content requests and rely less on centralized design support. That shift signals a more empowered, self-service model.
Reducing ad-hoc requests frees up designers to focus on strategic projects. It also gives sales and marketing teams faster access to the materials they need, without waiting in line.
If you haven’t measured this yet using a DAM Templating system like Marq, consider running a quick audit by department.
Count how many content requests your team receives in a month. Then track how that changes after rolling out templates or a centralized asset hub.
You can also pair creative ticket request counts with qualitative data. Ask teams if content feels easier to access, or if turnaround times have improved.
5. Revenue proxy
Not every result ties directly to revenue, but you can often use a proxy to show cost savings or gains in capacity.
The University of New Mexico offers a clear example.
Before implementing Marq, their team waited three to four weeks for content. Afterward, turnaround times dropped to a day, or even hours. One team member estimated that Marq’s platform did the work of five graphic designers.
That kind of proxy helps frame brand enablement as a multiplier—something that increases output without growing headcount.
Overall, the quantity of content production has increased significantly, and we have a lot of happy clients who are very excited they can turn around their materials in just a couple of days or even hours. In fact, one of our marketing managers said she would need five graphic designers to produce the amount of content she’s been able to produce with Marq.
Lydia Thomas, University of New Mexico senior marketing representative
Quantitative vs Qualitative ROI, and Why You Need Both
The five metrics we’ve covered so far focus on quantitative data. These numbers help show where brand enablement saves time, improves consistency, and increases efficiency. But numbers alone don’t tell the full story.
Qualitative feedback adds important context. It’s essential when you need to show how brand enablement supports collaboration, productivity, and brand perception across teams.
Here are a few key areas where qualitative data strengthens your ROI story:
-
Brand sentiment: Track how customers and internal teams feel about the brand. Run a survey before and after your enablement rollout to capture changes in perception, clarity, and confidence.
-
Content satisfaction: Ask stakeholders (especially sales and regional marketing teams) how well the content they receive meets their needs. High satisfaction often signals strong brand enablement at work.
-
Ease-of-use signals: Look for signs that teams can access and use branded materials with less friction. This might come through direct feedback or informal conversations during onboarding and training.
-
Productivity indicators: Watch for comments about faster turnaround times or smoother collaboration. These insights help uncover where brand enablement is removing bottlenecks or reducing dependency on central design teams.
When paired with hard data, this kind of feedback helps you tell a complete story. It brings your metrics to life and connects brand enablement to the real experiences of the people using your tools and templates every day.
How to Present Brand Enablement ROI to Stakeholders
Once you’ve gathered your data, the next step is to present it in a way that earns attention and buy-in.
This part can be deceptively difficult.
If you spend too much time compiling reports or chasing down metrics, the process starts to undercut the value you’re trying to prove. Brand enablement should streamline operations, not add complexity.
That’s why we built Marq’s analytics with presentation in mind. The platform helps you track performance, content usage, and surface insights automatically, so you can focus on strategy, not spreadsheets.
When you share results with stakeholders, highlight how brand enablement impacts real business outcomes:
- Time saved
- Requests reduced
- Consistency improved
- Assets reused
- Teams empowered
Then, combine your findings with relevant qualitative feedback, starting with input from departments already relying heavily on branded materials. Show how the changes affect their day-to-day work and output.
The clearer your story, the easier it is to secure alignment, unlock resources, and reinforce brand enablement as a key strategic initiative.
Where Marq Helps You Present and Prove ROI (Without Guesswork)
Proving ROI shouldn’t require hours of manual tracking or guesswork. That’s why Marq is built to surface the data that matters most automatically.
Instead of chasing down metrics across scattered tools, Marq gives you a centralized view of how brand enablement performs across your organization. The platform tracks usage, highlights patterns, and helps you pinpoint where teams gain speed, stay on-brand, and reduce friction.
Here’s what you can uncover with Marq analytics:
-
Template usage: See which templates teams use most, and how usage varies by department or region.
-
Version control: Identify duplicated or modified assets to spot breakdowns in brand compliance.
-
Self-service adoption: Track who creates content directly, and who still relies on centralized requests.
-
Efficiency gains: Surface time savings and process improvements that support scaling efforts.
-
Executive-ready data: Pull reports that show measurable outcomes, backed by both usage data and real feedback.
These insights turn brand enablement from a background effort into a visible driver of performance. You’ll have the data to support strategic conversations and the clarity to show how your team is delivering impact every day.
Interested in finding out more about brand enablement software like Marq?
View our comparison page to compare Marq with other tools like Adobe or Canva. Or schedule a demo today and discover how our platform can help you measure, visualize, and elevate your brand’s impact.
Final Thoughts: Getting Validation on Brand Enablement ROI
Brand enablement often works behind the scenes, but its impact shows up everywhere — through faster workflows, stronger brand presence, and more empowered teams.
Measuring that impact takes the right mix of metrics and feedback. The five core indicators (brand consistency, content velocity, asset reuse, content request reduction, and revenue proxies) offer a strong foundation.
When you layer in qualitative insights from the people using your systems every day, the value becomes even clearer.
You don’t need to rely on anecdotes or assumptions.
With the right tools, you can track what’s working, share results with confidence, and reinforce brand enablement as a strategic priority.
Marq helps make that possible. Our platform is designed to simplify the measurement process and give you the data you need to prove ROI on brand enablement.
Want to see how it works?
Schedule a demo to see how Marq can help.