Free pie chart maker
Quickly create and distribute a stunning pie chart with the Marq brand templating platform. You don’t have to be a design genius to put together something great. Our intuitive drag-and-drop editor puts the power in your hands.
Haven’t signed up yet?
Give us a try.
 Sign up with Google
By signing up you agree to our Terms of Service and Privacy Policy

Smart pie chart templates — smarter you.
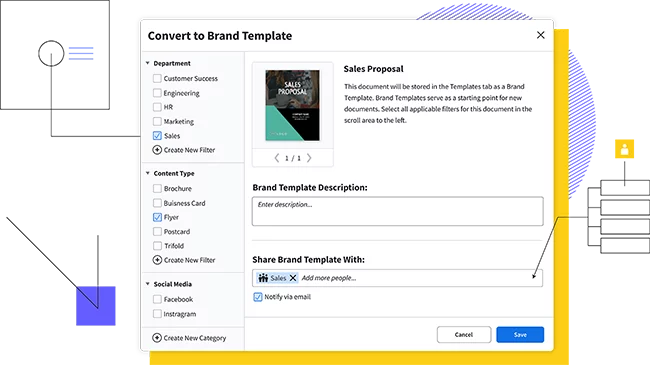
Not a professional designer? No problem. Choose from one of our hundreds of pie chart templates to get you started creating a professional pie chart. Customize the template by hand or upload your branding to access a collection of Smart Templates automatically customized to fit your brand.
Quick and easy
Our intuitive, drag-and-drop editor makes creating on-brand channel art quick and easy.

Grow your brand
Advanced template locking empowers team members to customize co-owned templates — without going off-brand, in turn helping ensure content remains consistent.

Empower your team
Share templates and brand assets with multiple team members and assign team roles to control who has access to what.
Share anywhere
Multi-channel distribution options — like on-demand printing, direct mail and digital publishing help you seamlessly share your newsletter with your audience.

Feature highlights
You don’t have to be a brilliant designer to craft beautiful data visualizations.
Make customizing content even easier by storing all your brand assets in one place.
With a web-based platform, no downloads or software installations are required, and you can access your Marq account from any browser or platform.
Smart Fields auto-populate information and images in your templates, so you don’t have to chase down information.
Use our Indesign Import feature to import existing InDesign files and convert them to Marq templates.
How to create a pie chart
Follow these steps to quickly create a pie chart in Marq.

Select a pie chart layout from the template gallery.

Use the endpoint to expand or contract each section to match the percentage amount for that category.

Adjust the colors on each section of the pie chart to match your branding.
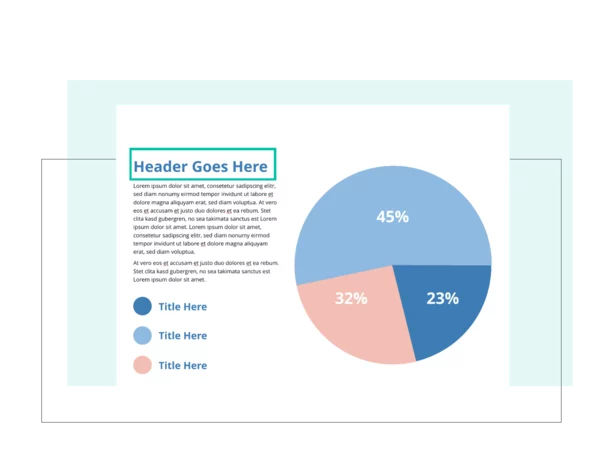
Include a descriptive title for the chart and add paragraphs of text to provide additional information and conclusions about the data. Don’t forget to add a data label.

Embed the chart in a presentation or infographic, download it as a standalone file or distribute the chart on social media.
Tell a story with our pie chart maker
Create all of your on-brand
collateral in Marq

Frequently asked questions
A pie chart is a circular chart that represents data as slices of a whole. Each slice represents a portion of the total, often expressed as a percentage. Pie charts are useful for illustrating proportions and showing the distribution of different categories within a dataset.
Absolutely! Marq’s pie chart maker is designed to cater to a wide range of users, from beginners to experienced professionals. The user-friendly interface and intuitive tools make it easy for anyone to create eye-catching and informative pie charts. If you’re looking for more advanced features, you’ll find customization options that cater to professionals as well.
Yes, Marq’s pie chart maker allows you to export your created charts in various formats, such as PNG, JPEG, or even PDF. This makes it easy to integrate your pie charts into presentations, reports, websites, or any other medium where you want to visually represent data.