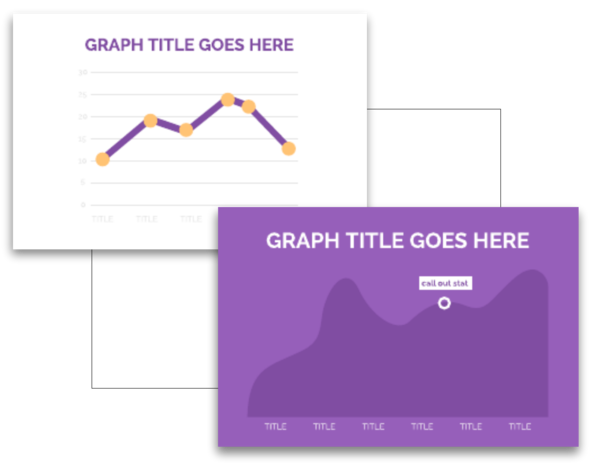
Not a professional designer? No problem. Choose from one of our hundreds of templates to get you started creating a professional line graph. Customize the template by hand or upload your branding to access a collection of Smart Templates automatically customized to fit your brand.
Free online line graph maker
Quickly create and distribute a stunning line graph with the Marq brand templating platform. With a powerfully intuitive editor, it’s never been easier to impress your audience… and yourself.

Haven't signed up yet?
Give us a try.
 Sign up with Google
By signing up you agree to our Terms of Service and Privacy Policy
Easy line graph design
With an intuitive, drag-and-drop editor, Marq is easy to learn. You’ll have a beautiful, finished line chart in minutes.
More features
Grow your brand
Enforce brand standards without obstructing creativity or customization needs with lockable templates.
More features
Empower your team
Share centralized and custom-made templates and assets across your team.
More features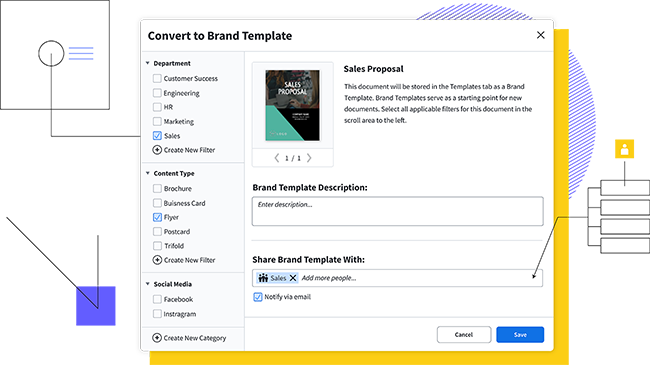
Share anywhere
Post your line graph on social media, download a PNG to add to a presentation or infographic or publish your line chart online.
More features
Why choose our line graph maker?
You don’t have to be a brilliant designer to craft beautiful data visualizations. Whether you’re a team of one or a team of five, our brand templating platform makes it easy to create content and build your brand.

Brand assets
Make customizing content even easier by storing all your brand assets in one place.

Web-based platform
With a web-based platform, no downloads or software installations are required, and you can access your Marq account from any browser or platform.

Data automation
Smart Fields auto-populate information and images in your templates, so you don't have to chase down information.

Easy Import
Access thousands of free stock photos or icons in the Marq editor or easily import your own from Dropbox or Facebook. Use our Indesign Import feature to import existing InDesign files and convert them to Marq templates.
How to make a line chart
Marq makes it easy to create stunning data visualizations.
1. Choose a line graph template
Choose from our collection of free line graph templates to quickly get started designing your graph.
2. Update the data
Adjust the axes of the chart and the height of the line based on your data set.
3. Add additional context
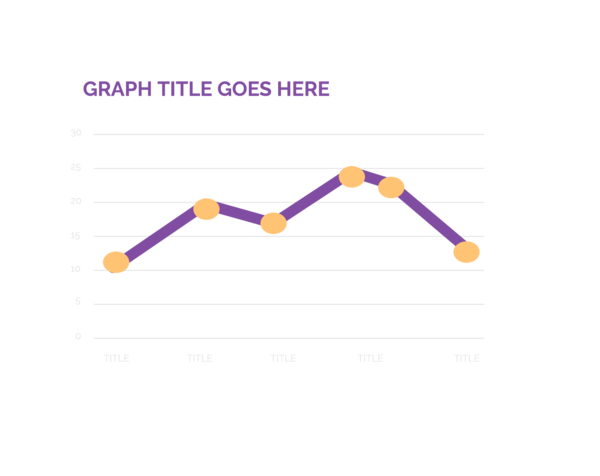
Incorporate axis labels, a title and additional copy to provide context to your line graph.
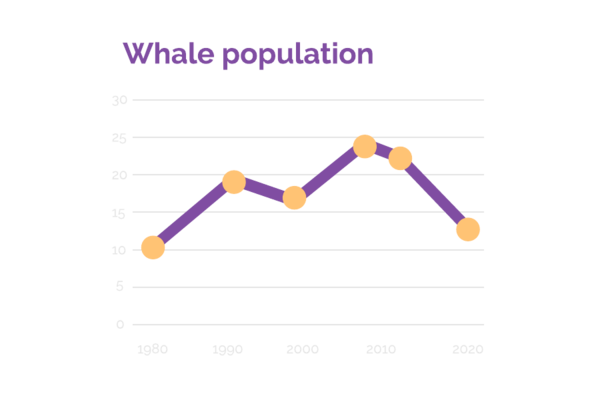
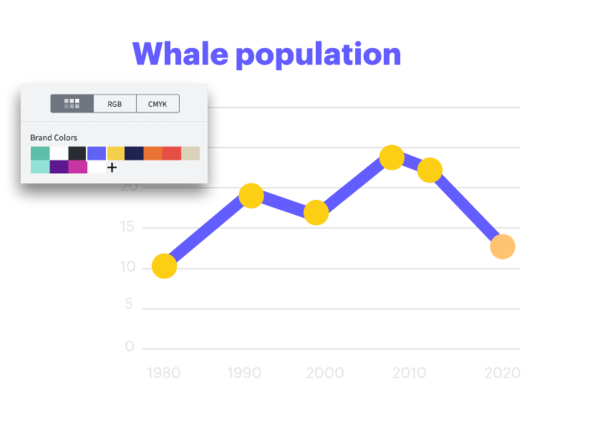
4. Update to match your brand
Swap out colors and fonts to match your brand identity.
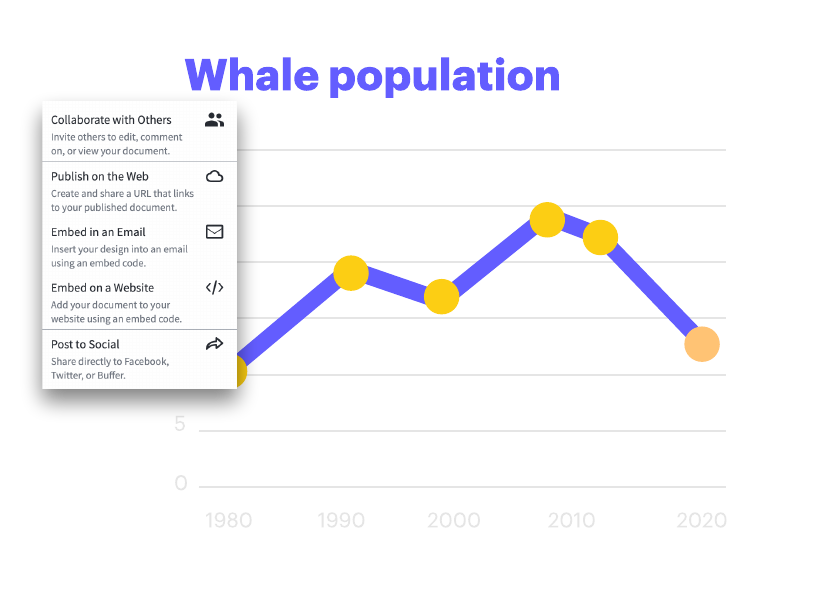
5. Distribute your line graph
Download, print or share your line graph online.
Create a line graph today
Start designingCreate all of your on-brand collateral in Marq


The #1 brand-templating platform trusted by over 6 million users worldwide
Find out whyFrequently asked questions
A line graph is a visual representation of data points connected by lines, illustrating trends and changes over time. It's an effective way to showcase relationships, patterns, and comparisons. Marq's Line Graph Maker allows you to create professional line graphs to present your data in a clear and engaging manner.
Absolutely! Marq's Line Graph Maker offers a range of customization options. You can choose different line styles, colors, labels, and axes to match your branding or presentation style. Whether you're creating business reports, academic presentations, or visualizing scientific data, our tool allows you to tailor the graph's appearance to your needs.
Yes, Marq's Line Graph Maker is designed to be user-friendly and intuitive, making it suitable for both beginners and experienced users. Our drag-and-drop interface and pre-designed templates make it easy to input and visualize your data, even if you have limited experience in data visualization.
Absolutely! Once you've created your line graph, you can easily export it in various formats such as PNG, JPEG, or PDF. This allows you to use the graph in presentations, reports, websites, or other platforms. Additionally, you can share your line graphs directly from Marq or embed them on your website for a seamless data presentation experience.