Not a professional designer? No problem. Choose from one of our hundreds of templates to get you started creating a professional infographic. Each template is completely customizable to match your brand. Customize by hand or unlock the power of Smart Brand Assets. Upload your brand’s colors, font and logo to access a collection of templates customized to your brand.
Free Infographic Maker
Marq's infographic maker is a cloud-based solution that will help you make a winning finished infographic design. With our intuitive, drag-and-drop editor creating beautiful, on-brand infographics is easy for everyone.

Haven't signed up yet?
Give us a try.
 Sign up with Google
By signing up you agree to our Terms of Service and Privacy Policy
Quick and easy
Our intuitive, drag-and-drop editor makes creating on-brand content quick and easy.
More features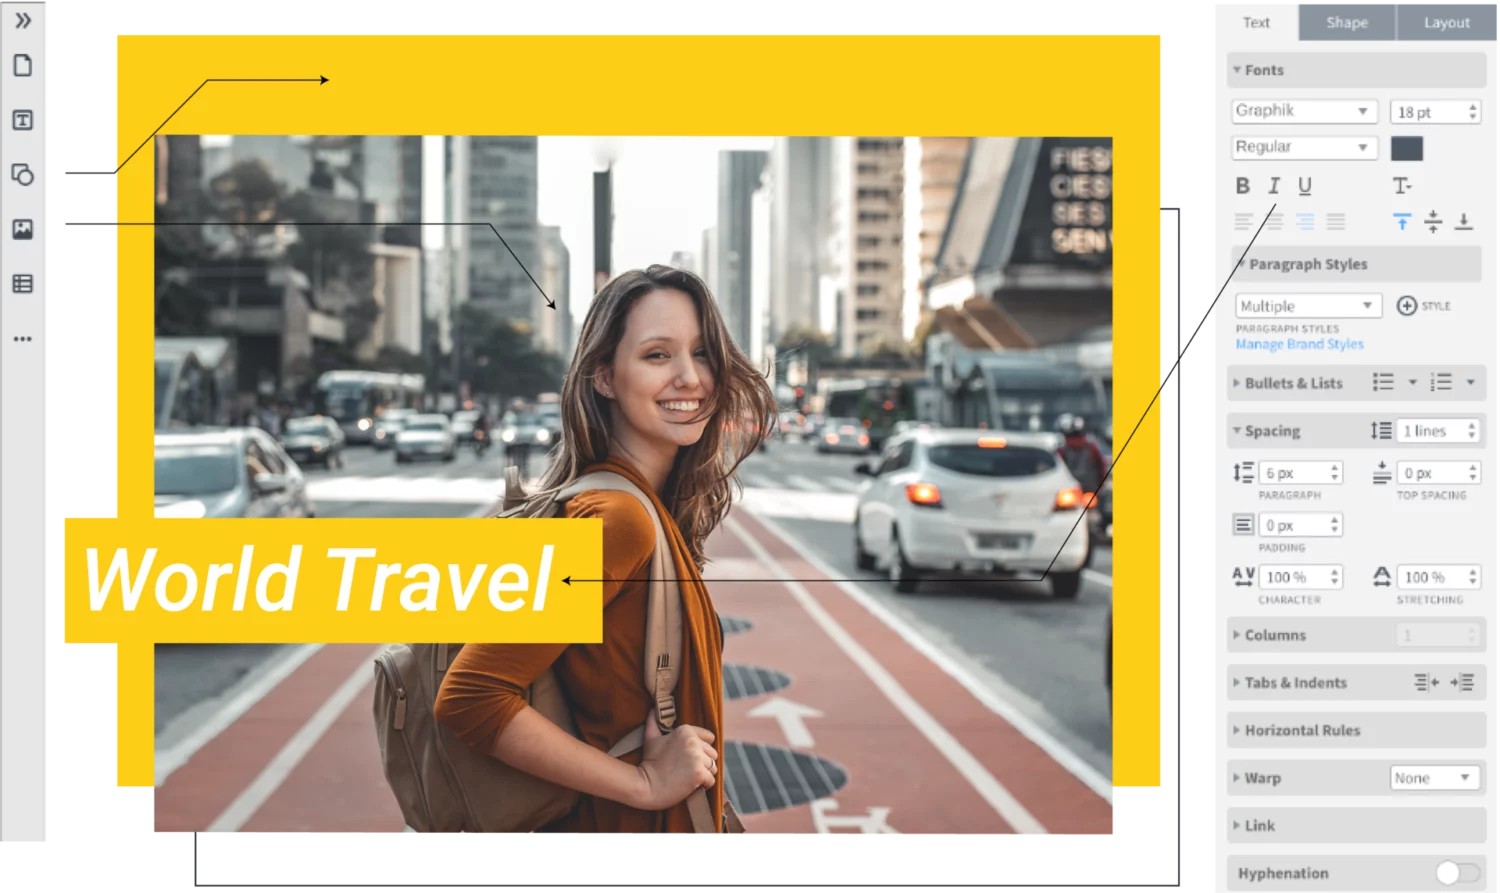
Grow your brand
Advanced template locking empowers team members to customize co-owned templates — without going off-brand, in turn helping ensure content remains consistent.
More features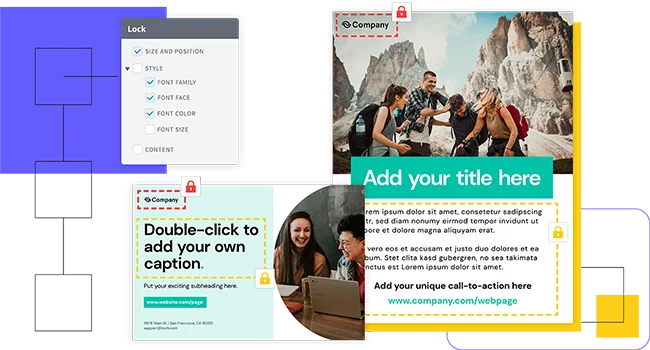
Empower your team
Share templates and brand assets with multiple team members and assign team roles to control who has access to what.
More features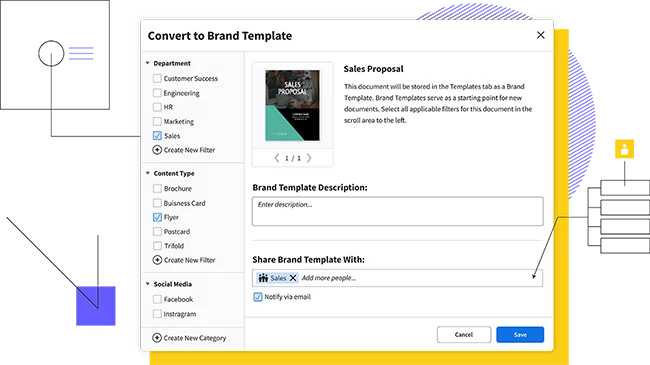
Feature highlights
You don’t have to be a brilliant designer to craft beautiful content. Whether you’re a team of one or a team of five, our brand templating platform makes it easy to create content and build your brand in the new design democracy.

Brand assets
Your business has a unique look and personality and so should your infographic. Store and access your brand's logos, fonts and colors to create beautiful, on-brand content.

Web-based platform
Unlike desktop publishing platforms, Marq is available right in the browser. You can access your infographics or other documents from any device. Switch between Mac and PC as you create compelling design collateral.

Data automation
Smart Fields auto-populate information in your templates, so you don't have to chase down information.

Easy Import
Use our handy integrations with Google Docs, YouTube, Dropbox, Facebook and InDesign to import existing content. Need stock photos? Use our Unsplash integration to quickly search for and add the perfect image to your infographic.
Creating an effective infographic
Marq can help you get started with infographic templates. From there, it’s up to you to fill in the template with helpful data, statistics and facts. The question then becomes, what does an effective infographic have that makes it stand out?
Tell a story
Good infographics tell great stories. Yes, you have lots of data that you want to share with your audience, but simply providing the data is boring. (Besides accountants and math majors, who wants to stare at a bunch of numbers all day?) An effective infographic takes that data and transforms it into a compelling story. The audience should be able to follow your story thanks to helpful visual elements like icons, images, charts and colors.
Turning your infographic into a story means turning hard numbers into something easy for the audience to understand. It grabs their attention from the start and creates a beautiful presentation where you communicate a message. In other words, infographics can transform the complex into something simple.

Drive engagement
Effective infographics aren’t just about telling stories. They can also be used to drive further engagement with your audience. A good infographic will be one that people want to share with their friends, family and coworkers. How many times have you seen a friend or colleague post an interesting infographic on social media? That’s a type of viral content that’s hard to create, but once you do, it can catch like wildfire. Make sure when you make your infographic that it has compelling visuals, with images that will draw in the reader and fascinating facts people will want to share.

Ready to make your infographic?
The infographic creator from Marq puts all this at your fingertips. With an intuitive interface and helpful infographic templates, you can make one of your own in only a few minutes. Choose from our library of images, icons and other graphics—or use some of your own to make something truly unique. Once you’re done, you can download and share it with others to really see your infographic take off.
Create all of your on-brand collateral in Marq


The #1 brand-templating platform trusted by over 6 million users worldwide
Find out whyFrequently asked questions
Infographics are visual representations of information, data, or knowledge designed to present complex concepts quickly and clearly. They are essential for conveying information in a visually engaging manner, making it easier for audiences to understand and remember key points.
Using Marq's infographic maker is simple. Choose a template that suits your content, customize it with your text, images, icons, and charts, and then fine-tune the design to match your branding. Our intuitive drag-and-drop interface makes designing infographics a breeze, even if you're not a graphic designer.
Absolutely! Marq's infographic maker provides a range of chart types and data visualization tools that allow you to present statistical information and trends in a visually appealing way. Whether you're showcasing survey results, market trends, or comparisons, our tool makes it easy to incorporate data into your infographics.
Infographics offer several advantages, including improved information retention, increased engagement on social media, and enhanced communication of complex ideas. They are shareable, attention-grabbing, and can help you stand out in a sea of textual content. With Marq's infographic maker, you can create compelling visuals that effectively convey your message to your target audience.