Not a professional designer? No problem. Choose from one of our hundreds of templates to get you started creating a professional graph or chart. Customize the template by hand or upload your branding to access a collection of Smart Templates automatically customized to fit your brand.
Free online chart and graph maker
Transform your data into a stunning graph or chart with the Marq brand templating platform. With our intuitive, drag-and-drop editor creating beautiful, on-brand graphs and charts is easy for everyone.

Haven't signed up yet?
Give us a try.
 Sign up with Google
By signing up you agree to our Terms of Service and Privacy Policy
Quick and easy
Great design requires a great deal of creativity. The last thing you need is software that blocks the flow of your ideas. With Marq, that’s not a problem. You arrange elements on the canvas with a simple drag-and-drop motion.
More features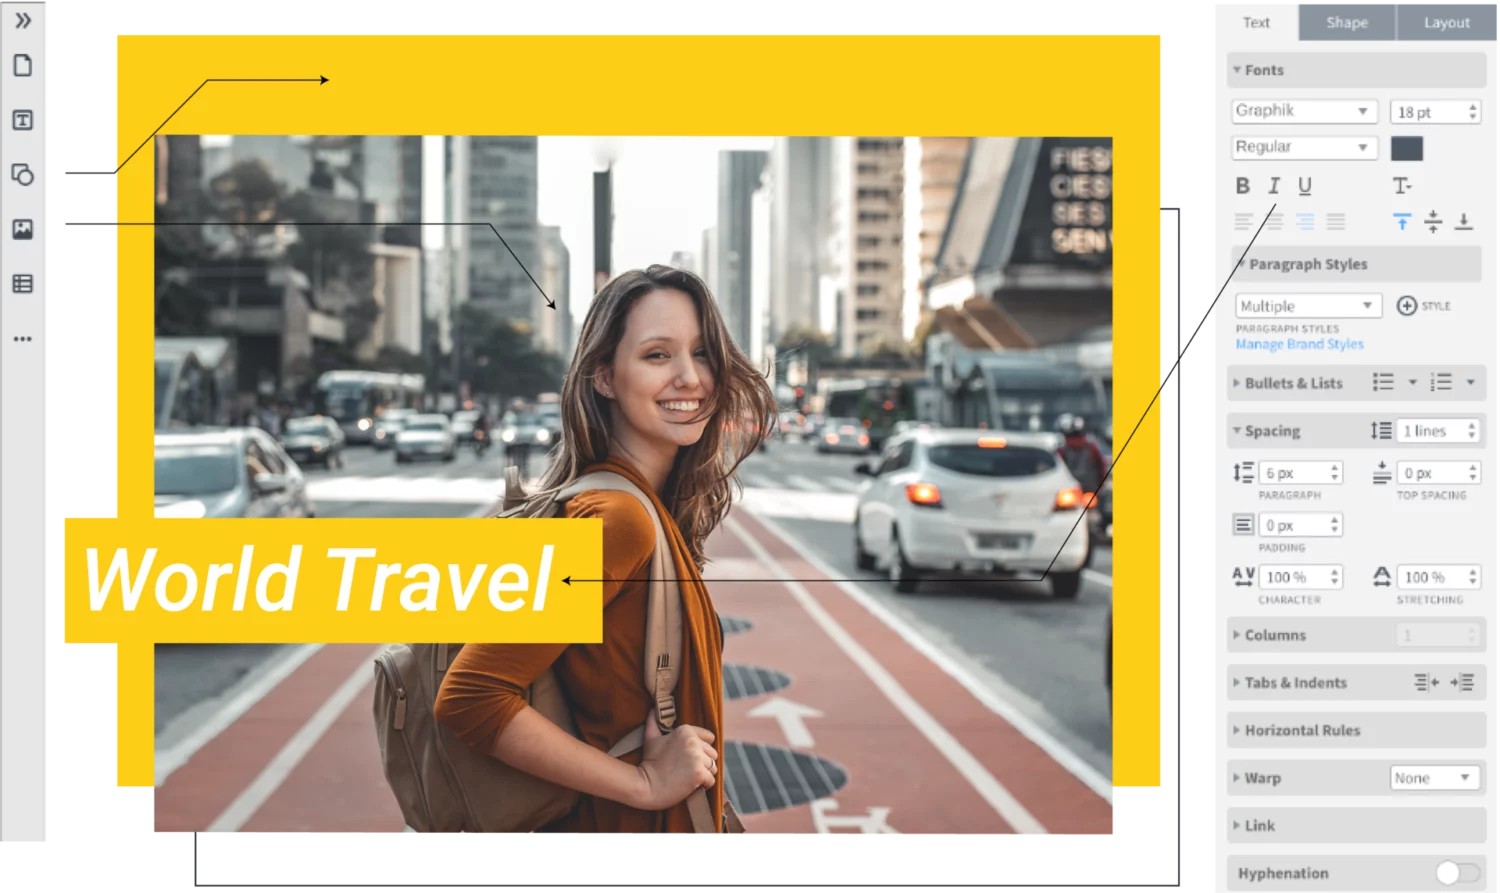
Grow your brand
Enforce brand standards without obstructing creativity or customization needs with lockable templates.
More features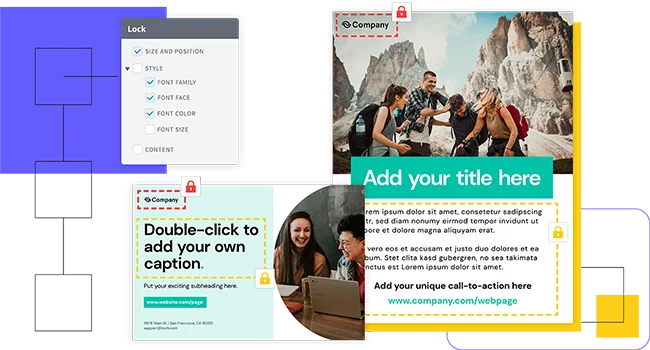
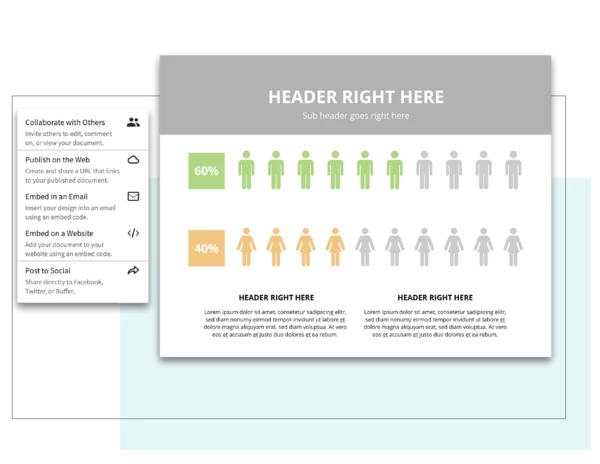
Empower your team
Looking for a seamless way to collaborate on a project? You're in luck. You and your friends, coworkers & clients can all work on a single document simultaneously. Get feedback, then implement it right away. Assign different roles and permissions to team members for simple and straight-forward team management.
More features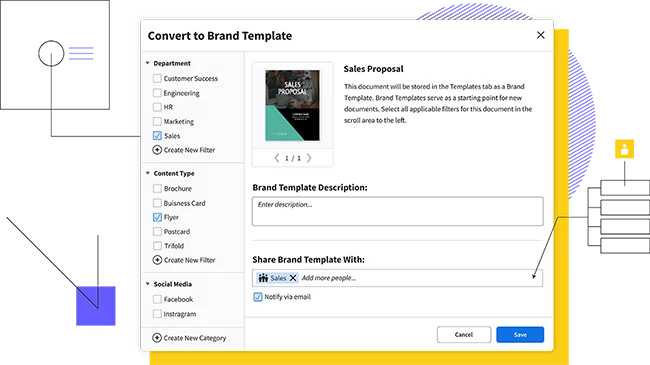
Why our chart and graph maker?
You don’t have to be a brilliant designer to craft beautiful content. Whether you’re a team of one or a team of five, our brand templating platform makes it easy to transform your data into charts and graphs that tell a story.

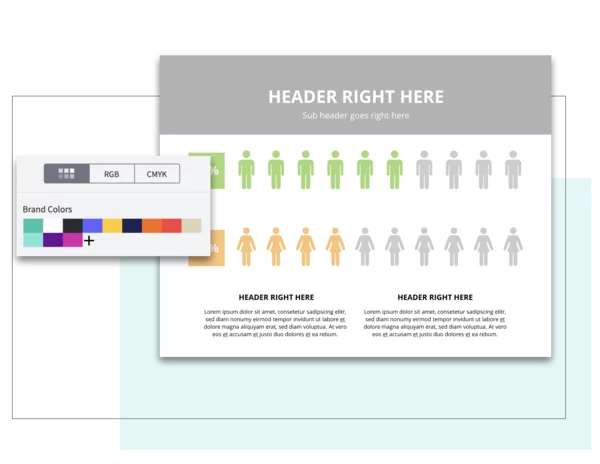
Brand assets
Your business has a unique look and personality and so should your graph. Store and access your brand's logos, fonts and colors to create beautiful, on-brand content.

Web-based platform
With a web-based platform, no downloads or software installations are required, and you can access your Marq account from any browser or platform.

Data automation
With smart fields or our advanced data automation feature, you can auto-populate information in your templates, cutting down on repetitive content updates.

Easy Import
Use our handy integrations with Google Docs, YouTube, Dropbox, Facebook and InDesign to import existing content.
How to create a graph or chart
Follow the steps below to quickly create a graph or chart in Marq.
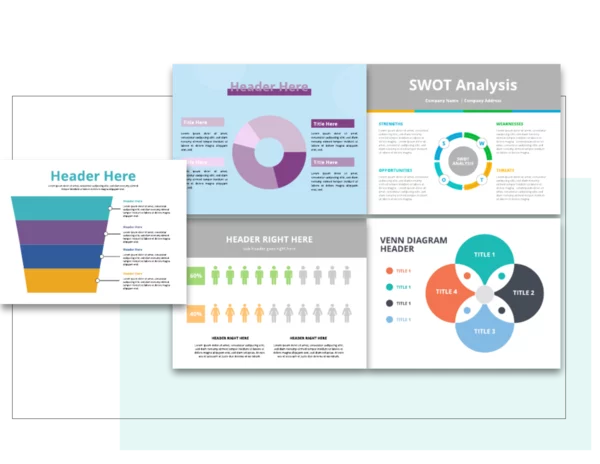
Choose a graph template
Marq offers templates for all types of diagrams from pie and bar charts to flow charts and venn diagrams.
Add your data
Adjust the chart area and data labels to match your values.
Customize to your brand
Update colors and fonts to match the chart to your brand.
Download and share
Download the final graph or embed it in a presentation, infographic or social media post.
Get started with our free graph maker today
Design a graphCreate all of your on-brand collateral in Marq


The #1 brand-templating platform trusted by over 6 million users worldwide
Find out whyFrequently asked questions
Marq's Chart and Graph Maker offers a wide variety of options, including bar charts, line graphs, pie charts, scatter plots, and more. You can choose the type that best suits your data and design preferences to effectively convey your information.
Absolutely! Marq's Chart and Graph Maker provides extensive customization options. You can adjust colors, labels, fonts, and other design elements to match your branding or presentation style. Create charts and graphs that align perfectly with your visual identity.
Inputting data is straightforward. You can either manually input your data or upload it from a spreadsheet or other compatible formats. Our intuitive interface guides you through the process, making it easy to create accurate and visually appealing charts and graphs.
Yes, you can! Once you've designed your charts and graphs, you can easily download them in various formats, such as PNG or PDF. This allows you to share them in presentations, reports, or on your website. You can also directly share your creations from Marq's platform for convenient collaboration and distribution.